
Microsoft Power BI is a business analytics service that provides interactive visualizations and business intelligence capabilities. It is a cloud-based service[1] that can be accessed from anywhere and on any device.
Power BI offers many benefits for businesses. It is powerful and can handle large amounts of data. It can be used to create visually immersive reports and dashboards that give businesses a near-live 360-degree view of their entire business in a single dashboard.
Power BI is an ideal solution for small businesses because it is powerful to handle large amounts of data and can be used to create visually immersive reports and dashboards that give small businesses a near-live 360-degree view of their entire business in a single dashboard. Additionally, Power BI is cloud-based, which means that small businesses do not need to invest in expensive hardware or software to use it.
Microsoft is a leader of Magic Quadrant for Analytics and Business Intelligence Platform.
Where can help an external consultant
External consultants can help in your Power BI projects in your organization. They can help you identify the right data sources, design effective reports and dashboards, identify areas where Power BI can be used more effectively within your organization. They bring expertise and experience to your Power BI project and can design and implement your solution more efficiently and effectively. Consultants can help you follow best practices for Power BI development and avoid common pitfalls while ensuring that your solution is scalable and maintainable.
Although Microsoft aimed to make certain basic reports without any special training during the design of Power BI Desktop, the precise and quick implementation of solution answers effectively to the business needs and the appearance of further data connections and integrations requires professionals with experience and knowledge, especially in the following areas:
- Data modeling: Data modeling is the process connecting data sources and designing the structure of your data in Power BI. This requires expertise in database design and data analysis.
- DAX coding: DAX (Data Analysis Expressions) is a formula language used in Power BI to create custom calculations and aggregations. This requires expertise in programming and data analysis.
- Visualization design: Visualization design is the process of creating effective and engaging visualizations in Power BI. This requires expertise in graphic design and data analysis.
- Performance optimization: Performance optimization is the process of improving the speed and efficiency of your Power BI solution. This requires expertise in database design, query optimization, and data analysis.
Typical use cases
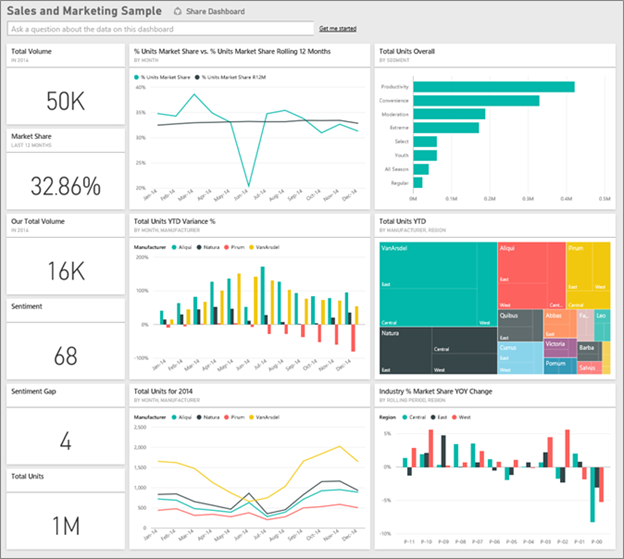
Sales and marketing analytics: Power BI can help you analyze your sales and marketing data to identify trends, opportunities, and areas for improvement. You can use Power BI to create dashboards and reports that show your sales performance, customer behavior, and more.
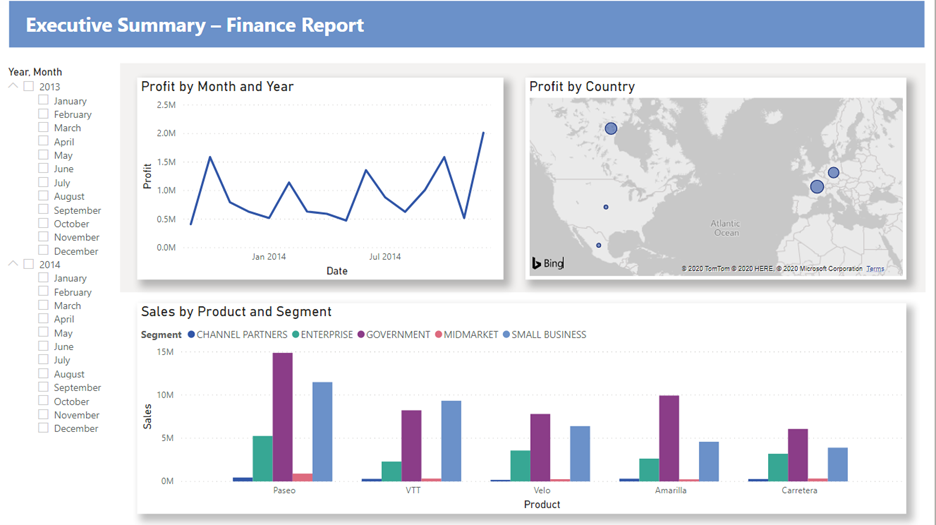
Financial analytics: Power BI can help you analyze your financial data to gain insights into your company’s financial performance. You can use Power BI to create dashboards and reports that show your revenue, expenses, cash flow, and more.
Human resources analytics: You can use Power BI to track the performance of your human resources teams. For example, you can create dashboards and reports that show employee turnover rates, headcount, performance metrics, and more.
Supply chain analytics: Power BI can help you analyze your supply chain data to identify bottlenecks, inefficiencies, and areas for improvement. You can use Power BI to create dashboards and reports that show your inventory levels, order fulfillment rates, shipping times, and more.
Healthcare analytics: Power BI can help you analyze your healthcare data to gain insights into patient outcomes, treatment effectiveness, and more. You can use Power BI to create dashboards and reports that show your patient satisfaction scores, readmission rates, mortality rates, and more
Education analytics: Power BI can help you analyze your education data to gain insights into student performance, enrollment trends, and more. You can use Power BI to create dashboards and reports that show your student retention rates, graduation rates, test scores, and more.
Retail analytics: Power BI can help you analyze your retail data to gain insights into customer behavior, inventory levels, and more. You can use Power BI to create dashboards and reports that show your sales performance, customer demographics, and more.
Manufacturing analytics: Power BI can help you analyze your manufacturing data to identify bottlenecks, inefficiencies, and areas for improvement. You can use Power BI to create dashboards and reports that show your production rates, quality metrics, and more.
IT analytics Power BI: can help you analyze your IT data to gain insights into your company’s technology infrastructure. You can use Power BI to create dashboards and reports that show your network performance, server uptime, security metrics, and more.
Social media analytics: Power BI can help you analyze your social media data to gain insights into customer sentiment, engagement rates, and more. You can use Power BI to create dashboards and reports that show your social media performance across different platforms.
Service maintenance analytics: You can use Power BI to track the performance of your service maintenance teams. For example, you can create dashboards and reports that show the number of service requests completed, the average time to complete a request, and more.
IT consultant analytics: You can use Power BI to track the performance of your IT consultants. For example, you can create dashboards and reports that show the utilization rate of resources, the number of tickets closed, the average time to resolve a ticket, and more.
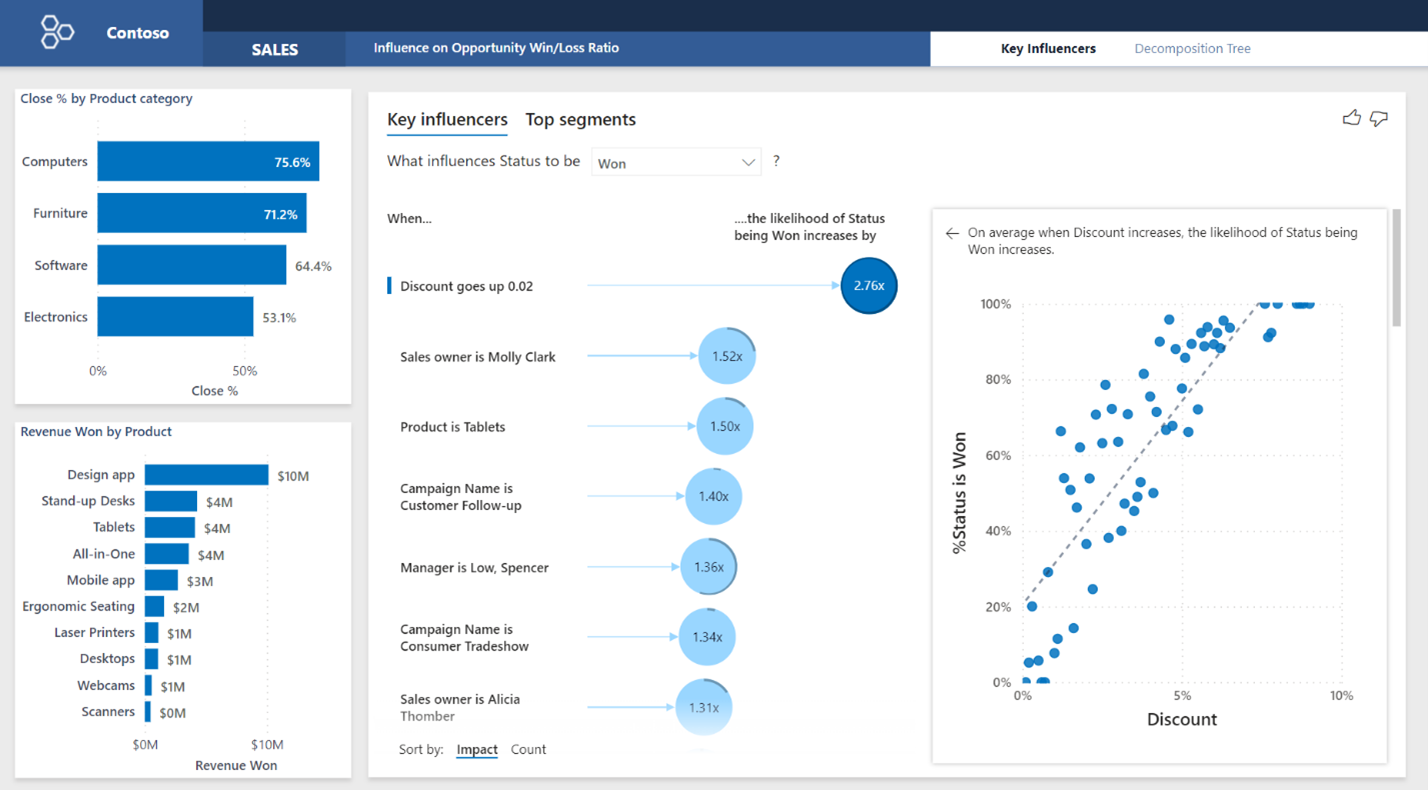
Examples of Power BI reports:
[1] The on-premises version of Power BI is called Power BI Report Server. It is a server that allows you to host and share Power BI reports within your organization’s firewall. Power BI Report Server is ideal for organizations that need to keep their data on-premises due to regulatory or compliance requirements. There are some disadvantages to PBI service, like limited data sources, collaboration, scalability and PBI service entering cost is lower (Report Server needs Power BI Premium plan).